Élections législatives de 2012 dans la Seine-Saint-Denis
En France, les élections législatives de 2012 se déroulent les et . En Seine-Saint-Denis, douze députés sont à élire dans le cadre de douze circonscriptions, soit une de moins que lors des législatures précédentes, en raison du redécoupage électoral.
| ||||||||||||||
| Élections législatives de 2012 dans la Seine-Saint-Denis | ||||||||||||||
| 12 sièges de députés à l'Assemblée nationale | ||||||||||||||
|---|---|---|---|---|---|---|---|---|---|---|---|---|---|---|
| et | ||||||||||||||
| Corps électoral et résultats | ||||||||||||||
| Inscrits au 1er tour | 741 205 | |||||||||||||
| Votants au 1er tour | 363 657 | |||||||||||||
| 49,06 % | ||||||||||||||
| Votes exprimés au 1er tour | 358 052 | |||||||||||||
| Inscrits au 2d tour | 741 900 | |||||||||||||
| Votants au 2d tour | 317 331 | |||||||||||||
| 42,77 % | ||||||||||||||
| Votes exprimés au 2d tour | 286 841 | |||||||||||||
| Majorité présidentielle | ||||||||||||||
| Voix au 1er tour | 145 587 | |||||||||||||
| 40,66 % | ||||||||||||||
| Voix au 2e tour | 164 219 | |||||||||||||
| 57,25 % | ||||||||||||||
| Députés élus | 9 | |||||||||||||
| Union de la droite et du centre | ||||||||||||||
| Voix au 1er tour | 83 429 | |||||||||||||
| 23,30 % | ||||||||||||||
| Voix au 2e tour | 74 435 | |||||||||||||
| 25,95 % | ||||||||||||||
| Députés élus | 1 | |||||||||||||
| Front de gauche | ||||||||||||||
| Voix au 1er tour | 63 921 | |||||||||||||
| 17,85 % | ||||||||||||||
| Voix au 2e tour | 40 670 | |||||||||||||
| 14,18 % | ||||||||||||||
| Députés élus | 2 | |||||||||||||
| Front national | ||||||||||||||
| Voix au 1er tour | 42 258 | |||||||||||||
| 11,80 % | ||||||||||||||
| Voix au 2e tour | 7 517 | |||||||||||||
| 2,62 % | ||||||||||||||
| Députés élus | 0 | |||||||||||||
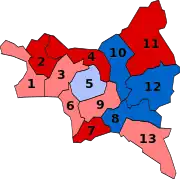
| Députés sortants par circonscription | ||||||||||||||
| ||||||||||||||
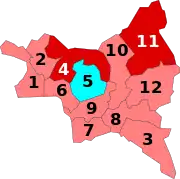
| Députés élus par circonscription | ||||||||||||||
| ||||||||||||||
Élus
Impact du redécoupage territorial
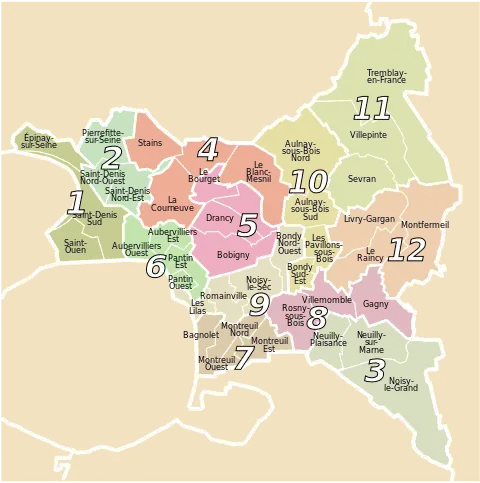
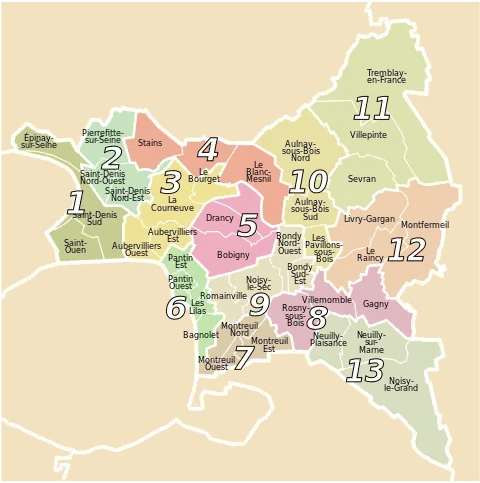
Circonscriptions de la Seine-Saint-Denis en 2012
Circonscriptions de la Seine-Saint-Denis en 1986
Lors du redécoupage territorial opéré en 2010, le nombre de circonscriptions électorales de la Seine-Saint-Denis a été ramené de treize à douze, en raison de la sur-représentation démographique du département. Les 1re, 2e, 8e et 11e circonscriptions n'ont pas été affectées par ce découpage. En revanche, la 3e a été démantelée et son territoire a été réparti entre les 4e, 5e et 6e. Les limites des 6e, 7e et 9e ont été redéfinies. La 13e a pris le nom de 3e circonscription.
Résultats
Résultats à l'échelle du département
| Parti | Premier tour | Second tour | Sièges | ||||
|---|---|---|---|---|---|---|---|
| Voix | % | Voix | % | ||||
| Parti socialiste | 126 961 | 35,46 | 164 219 | 57,25 | 9 | ||
| Europe Écologie Les Verts | 18 014 | 5,03 | 0 | ||||
| Divers gauche dont MRC | 612 | 0,17 | 0 | ||||
| Majorité présidentielle | 145 587 | 40,66 | 164 219 | 57,25 | 9 | ||
| Union pour un mouvement populaire | 59 460 | 16,61 | 58 307 | 20,33 | 0 | ||
| Nouveau centre | 19 794 | 5,53 | 16 128 | 5,62 | 1 | ||
| Divers droite dont DLR et PCD | 3 465 | 0,97 | 0 | ||||
| Alliance centriste | 710 | 0,20 | 0 | ||||
| Droite parlementaire | 83 429 | 23,30 | 74 435 | 25,95 | 1 | ||
| Front de gauche | 63 921 | 17,85 | 40 670 | 14,18 | 2 | ||
| Front national | 42 258 | 11,80 | 7 517 | 2,62 | 0 | ||
| Divers | 7 698 | 2,15 | 0 | ||||
| Extrême gauche dont LO, NPA et POI | 6 600 | 1,84 | 0 | ||||
| Mouvement démocrate | 4 535 | 1,27 | 0 | ||||
| Divers écologiste dont LT-LNÉ, AÉI et Cap21 | 2 564 | 0,72 | 0 | ||||
| Extrême droite | 1 460 | 0,41 | 0 | ||||
| Inscrits | 741 205 | 100,00 | 741 900 | 100,00 | 12 | ||
| Abstentions | 377 548 | 50,94 | 424 569 | 57,23 | |||
| Votants | 363 657 | 49,06 | 317 331 | 42,77 | |||
| Blancs et nuls | 5 605 | 1,54 | 30 490 | 9,61 | |||
| Exprimés | 358 052 | 98,46 | 286 841 | 90,39 | |||
Première circonscription (Saint-Denis-Sud)
| Candidat | Parti | Premier tour | Second tour | ||||
|---|---|---|---|---|---|---|---|
| Voix | % | Voix | % | ||||
| Bruno Le Roux sortant réélu | PS | 11 928 | 47,46 | 15 060 | 100,00 | ||
| Hayat Dhalfa | FG (PG) | 3 573 | 14,22 | Retrait | |||
| Salah Bourdi | NC (UMP) | 2 755 | 10,96 | ||||
| Blandine Dejouy | FN | 2 688 | 10,69 | ||||
| Mike Borowski | MoDem | 1 234 | 4,91 | ||||
| Mamadou Keita | EÉLV | 1 187 | 4,72 | ||||
| Youssef El Ouachouni | Divers | 806 | 3,21 | ||||
| Bernard Brès | 320 | 1,27 | |||||
| Naïma Amiri | NPA | 274 | 1,09 | ||||
| Cécile Abad | LO | 195 | 0,78 | ||||
| Rosy Aline[1] | PCD | 110 | 0,44 | ||||
| Élise Mbock | Divers | 50 | 0,20 | ||||
| Étienne Zoldi Dedieu | Pirate | 14 | 0,06 | ||||
| Inscrits | 55 214 | 100,00 | 55 214 | 100,00 | |||
| Abstentions | 29 690 | 53,77 | 36 567 | 66,23 | |||
| Votants | 25 524 | 46,23 | 18 647 | 33,77 | |||
| Blancs et nuls | 390 | 1,53 | 3 587 | 19,24 | |||
| Exprimés | 25 134 | 98,47 | 15 060 | 80,76 | |||
Deuxième circonscription (Saint-Denis-Nord)
| Candidat | Parti | Premier tour | Second tour | ||||
|---|---|---|---|---|---|---|---|
| Voix | % | Voix | % | ||||
| Mathieu Hanotin élu | PS | 8 080 | 36,51 | 11 000 | 53,50 | ||
| Patrick Braouezec sortant | FG (FASE) | 6 897 | 31,17 | 9 561 | 46,50 | ||
| Alain Polu | FN | 2 094 | 9,46 | ||||
| Vijay Monany | UMP | 2 018 | 9,12 | ||||
| Dieunor Excellent | Divers | 1 086 | 4,91 | ||||
| Dominique Carré | EÉLV | 649 | 2,93 | ||||
| Catherine Billard | NPA | 263 | 1,19 | ||||
| Houari Guermat | MoDem | 262 | 1,18 | ||||
| Mohamed Amine Khouidrat | AÉI | 197 | 0,89 | ||||
| Jean-Pierre Enjalbert | DLR | 171 | 0,77 | ||||
| Philippe Julien | LO | 160 | 0,72 | ||||
| Françoise Marguerite-Barbeito[2] | MRC | 141 | 0,64 | ||||
| Pierre Feuillette | Pirate | 109 | 0,49 | ||||
| Véronique Landwerlin[3] | PCD | 1 | 0,00 | ||||
| Inscrits | 51 767 | 100,00 | 52 134 | 100,00 | |||
| Abstentions | 29 260 | 56,52 | 30 177 | 57,88 | |||
| Votants | 22 507 | 43,48 | 21 957 | 42,12 | |||
| Blancs et nuls | 379 | 1,68 | 1 396 | 6,36 | |||
| Exprimés | 22 128 | 98,32 | 20 561 | 93,64 | |||
Troisième circonscription (Noisy-le-Grand)
| Candidat | Parti | Premier tour | Second tour | ||||
|---|---|---|---|---|---|---|---|
| Voix | % | Voix | % | ||||
| Michel Pajon sortant réélu | PS | 16 245 | 44,19 | 20 910 | 60,38 | ||
| Bruno Beschizza | UMP | 9 445 | 25,69 | 13 721 | 39,62 | ||
| Renée Asselin | FN | 4 535 | 12,34 | ||||
| Riva Gherchanoc | FG (PG) | 2 827 | 7,69 | ||||
| Sylvie Duffrene | EÉLV | 1 759 | 4,79 | ||||
| Louise Ben Mami | LT-LNÉ | 431 | 1,17 | ||||
| Audrey Levasseur | PCD | 400 | 1,09 | ||||
| Daniela Foubert | DLR | 301 | 0,82 | ||||
| Michel Paulin | 273 | 0,74 | |||||
| Sébastien Biscaro | NPA | 212 | 0,58 | ||||
| Maëlle Gaucherand | LO | 190 | 0,52 | ||||
| Maurice Stobnicer[4] | POI | 142 | 0,39 | ||||
| Inscrits | 70 715 | 100,00 | 70 715 | 100,00 | |||
| Abstentions | 33 402 | 47,23 | 34 748 | 49,14 | |||
| Votants | 37 313 | 52,77 | 35 967 | 50,86 | |||
| Blancs et nuls | 553 | 1,48 | 1 336 | 3,71 | |||
| Exprimés | 36 760 | 98,52 | 34 631 | 96,29 | |||
Quatrième circonscription (Stains)
| Candidat | Parti | Premier tour | Second tour | ||||
|---|---|---|---|---|---|---|---|
| Voix | % | Voix | % | ||||
| Marie-George Buffet sortante réélue | FG (PCF) | 8 731 | 33,64 | 15 031 | 100,00 | ||
| Najia Amzal | PS | 7 914 | 30,49 | Retrait | |||
| Thierry Meignen | UMP | 4 339 | 16,72 | ||||
| Gilles Clavel | FN | 3 511 | 13,53 | ||||
| Estelle Vulliez | EÉLV | 496 | 1,91 | ||||
| Edwin Legris | AC | 424 | 1,63 | ||||
| Line Teboul-Roques | POI | 147 | 0,57 | ||||
| Aurélie Murua | NPA | 145 | 0,56 | ||||
| Serge Fournet | LO | 144 | 0,55 | ||||
| Chancard Moïse Kanga | PCD | 104 | 0,40 | ||||
| Inscrits | 60 162 | 100,00 | 60 162 | 100,00 | |||
| Abstentions | 33 688 | 56 | 40 677 | 67,61 | |||
| Votants | 26 474 | 44 | 19 485 | 32,39 | |||
| Blancs et nuls | 519 | 1,96 | 4 454 | 22,86 | |||
| Exprimés | 25 955 | 98,04 | 15 031 | 77,14 | |||
Cinquième circonscription (Bobigny)
| Candidat | Parti | Premier tour | Second tour | ||||
|---|---|---|---|---|---|---|---|
| Voix | % | Voix | % | ||||
| Jean-Christophe Lagarde sortant réélu | NC | 12 868 | 43,46 | 16 128 | 56,73 | ||
| Milouda Latrèche | PS | 6 103 | 20,61 | 12 301 | 43,27 | ||
| Abdel-Madjid Sadi | FG (PCF) | 5 558 | 18,87 | ||||
| Herminia Fardeau | FN | 2 699 | 9,11 | ||||
| Michel Mathieu | Divers | 879 | 2,97 | ||||
| Djamila Bekkaye | EÉLV | 276 | 0,93 | ||||
| Carole Brévière | MoDem | 260 | 0,88 | ||||
| Véronique Clément | Divers | 209 | 0,71 | ||||
| Djafar Hamoum | Divers | 198 | 0,67 | ||||
| Isabelle Couffin-Guérin | LO | 173 | 0,58 | ||||
| Roxianne Boisson | DLR | 133 | 0,45 | ||||
| Frédéric Perrod | Pirate | 127 | 0,43 | ||||
| Émile Fabrol | NPA | 99 | 0,33 | ||||
| Inscrits | 62 242 | 100,00 | 62 241 | 100,00 | |||
| Abstentions | 32 218 | 51,76 | 32 994 | 53,01 | |||
| Votants | 30 024 | 48,24 | 29 247 | 46,99 | |||
| Blancs et nuls | 412 | 1,37 | 818 | 2,8 | |||
| Exprimés | 29 612 | 98,63 | 28 429 | 97,2 | |||
Sixième circonscription (Aubervilliers)
| Candidat | Parti | Premier tour | Second tour | ||||
|---|---|---|---|---|---|---|---|
| Voix | % | Voix | % | ||||
| Élisabeth Guigou élue | PS | 10 390 | 46,12 | 14 376 | 100,00 | ||
| Patrick Le Hyaric | FG (PCF) | 3 905 | 17,33 | Retrait | |||
| Ilona Zsoter | UMP | 3 021 | 13,41 | ||||
| Cyril Bozonnet | FN | 2 299 | 10,20 | ||||
| Christine Ratzel-Togo | EÉLV | 974 | 4,32 | ||||
| Nathalie Arthaud | LO | 557 | 2,47 | ||||
| Claire Vigeant | MoDem | 545 | 2,42 | ||||
| Linda Sehili | NPA | 183 | 0,81 | ||||
| Patrick Lozès | Divers | 163 | 0,72 | ||||
| Christian Van Houcke | AÉI | 146 | 0,65 | ||||
| Palmerido Valente | Divers gauche | 139 | 0,62 | ||||
| Kamélia Kincaid | POI | 107 | 0,47 | ||||
| Jérôme Sinpaseuth[5] | S&P | 101 | 0,45 | ||||
| Inscrits | 49 966 | 100,00 | 49 966 | 100,00 | |||
| Abstentions | 27 079 | 54,19 | 31 964 | 63,97 | |||
| Votants | 22 887 | 45,81 | 18 002 | 36,03 | |||
| Blancs et nuls | 357 | 1,56 | 3 626 | 20,14 | |||
| Exprimés | 22 530 | 98,44 | 14 376 | 79,86 | |||
Septième circonscription (Montreuil)
| Candidat | Parti | Premier tour | Second tour | ||||
|---|---|---|---|---|---|---|---|
| Voix | % | Voix | % | ||||
| Razzy Hammadi élu | PS | 13 001 | 36,71 | 16 121 | 100,00 | ||
| Jean-Pierre Brard sortant | FG (CAP) | 11 599 | 32,75 | Retrait | |||
| Muriel Bessis | NC (UMP) | 3 794 | 10,71 | ||||
| Annie Habert | FN | 2 867 | 8,10 | ||||
| Nathalie Gomez | Divers | 1 021 | 2,88 | ||||
| François Mailloux | NPA | 724 | 2,04 | ||||
| David Xardel | MoDem | 713 | 2,01 | ||||
| Alain Bozaric | AÉI | 374 | 1,06 | ||||
| Yannick Penneçot | Pirate | 306 | 0,86 | ||||
| Jean-Pierre Mercier | LO | 254 | 0,72 | ||||
| Christel Keiser | POI | 236 | 0,67 | ||||
| Béatrice Desmartin | MRC | 219 | 0,62 | ||||
| Marc Couëdic | DLR | 210 | 0,59 | ||||
| Salim Khelif | Divers | 70 | 0,20 | ||||
| Laure Glémain | Divers | 16 | 0,05 | ||||
| Samira Baibi | Divers | 11 | 0,03 | ||||
| Inscrits | 70 898 | 100,00 | 71 233 | 100,00 | |||
| Abstentions | 34 878 | 49,19 | 48 710 | 68,38 | |||
| Votants | 36 020 | 50,81 | 22 523 | 31,62 | |||
| Blancs et nuls | 605 | 1,68 | 6 402 | 28,42 | |||
| Exprimés | 35 415 | 98,32 | 16 121 | 71,58 | |||
Huitième circonscription (Gagny)
| Candidat | Parti | Premier tour | Second tour | ||||
|---|---|---|---|---|---|---|---|
| Voix | % | Voix | % | ||||
| Élisabeth Pochon élue | PS | 12 371 | 37,88 | 16 508 | 50,85 | ||
| Patrice Calméjane sortant | UMP | 11 627 | 35,60 | 15 956 | 49,15 | ||
| Daniel Bousselaire | FN | 3 920 | 12,00 | ||||
| Bruno Bellegarde | FG (PG) | 2 035 | 6,23 | ||||
| Frédéric Lorenzo | MoDem | 852 | 2,61 | ||||
| Aurélien Berthou | EÉLV | 851 | 2,61 | ||||
| Marcel Forestier | Extrême droite (MNR) | 280 | 0,86 | ||||
| Sarah Ben Ammar | Divers droite (DLR) | 241 | 0,74 | ||||
| Abdelnacer Debbouzza | Divers écologiste (AÉI) | 231 | 0,71 | ||||
| Jihane Bensalah | Extrême gauche (NPA) | 137 | 0,42 | ||||
| Gaëtan Minardi | Extrême gauche (LO) | 114 | 0,35 | ||||
| Inscrits | 60 129 | 100,00 | 60 135 | 100,00 | |||
| Abstentions | 26 994 | 44,89 | 26 799 | 44,56 | |||
| Votants | 33 135 | 55,11 | 33 336 | 55,44 | |||
| Blancs et nuls | 476 | 1,44 | 872 | 2,62 | |||
| Exprimés | 32 659 | 98,56 | 32 464 | 97,38 | |||
Neuvième circonscription (Noisy-le-Sec)
| Candidat | Parti | Premier tour | Second tour | ||||
|---|---|---|---|---|---|---|---|
| Voix | % | Voix | % | ||||
| Claude Bartolone[6] sortant réélu | PS | 15 857 | 48,66 | 22 921 | 75,30 | ||
| Élisabeth Courtial | FN | 4 713 | 14,46 | 7 517 | 24,70 | ||
| Pascale Labbé | FG (PCF) | 4 251 | 13,04 | ||||
| Dref Mendaci | NC (UMP) | 4 171 | 12,80 | ||||
| Pierre Stoeber | EÉLV | 1 743 | 5,35 | ||||
| Georges Amzel | MoDem | 711 | 2,18 | ||||
| Romain Rivière | Divers (Pirate) | 404 | 1,24 | ||||
| Jean-Paul Burot | Extrême gauche (LO) | 283 | 0,87 | ||||
| Fatima Bariki Alaoui | Divers écologiste (AÉI) | 268 | 0,82 | ||||
| Gaëlle Komorn | Extrême gauche (NPA) | 189 | 0,58 | ||||
| Inscrits | 66 535 | 100,00 | 66 536 | 100,00 | |||
| Abstentions | 33 347 | 50,12 | 34 336 | 51,61 | |||
| Votants | 33 188 | 49,88 | 32 200 | 48,39 | |||
| Blancs et nuls | 598 | 1,8 | 1 762 | 5,47 | |||
| Exprimés | 32 590 | 98,2 | 30 438 | 94,53 | |||
Dixième circonscription (Aulnay-sous-Bois)
| Candidat | Parti | Premier tour | Second tour | ||||
|---|---|---|---|---|---|---|---|
| Voix | % | Voix | % | ||||
| Daniel Goldberg sortant réélu | PS | 12 659 | 39,23 | 17 714 | 55,95 | ||
| Gérard Gaudron sortant | UMP | 9 890 | 30,65 | 13 948 | 44,05 | ||
| Atika Keddouh | FN | 3 431 | 10,63 | ||||
| Marie-Jeanne Quéruel | FG (PCF) | 2 134 | 6,61 | ||||
| Hervé Suaudeau | EÉLV | 959 | 2,97 | ||||
| Mimoun El Hejraoui | Divers | 871 | 2,70 | ||||
| Amélie Pinheiro | MoDem | 380 | 1,18 | ||||
| Sébastien Ville | NPA | 353 | 1,09 | ||||
| Roland Curtet | MNR | 338 | 1,05 | ||||
| Billel Ouadah | AC | 286 | 0,89 | ||||
| Aurore Delamare | LT-LNÉ | 273 | 0,85 | ||||
| Fatou Meïte | Divers | 196 | 0,61 | ||||
| Agathe Martin | LO | 170 | 0,53 | ||||
| Michel Lefebvre | POI | 124 | 0,38 | ||||
| Rachid Mokran | AÉI | 102 | 0,32 | ||||
| Marc Masnikosa | Cap21 | 100 | 0,31 | ||||
| Inscrits | 67 078 | 100,00 | 67 064 | 100,00 | |||
| Abstentions | 34 332 | 51,18 | 34 475 | 51,41 | |||
| Votants | 32 746 | 48,82 | 32 589 | 48,59 | |||
| Blancs et nuls | 480 | 1,47 | 927 | 2,84 | |||
| Exprimés | 32 266 | 98,53 | 31 662 | 97,16 | |||
Onzième circonscription (Sevran)
| Candidat | Parti | Premier tour | Second tour | ||||
|---|---|---|---|---|---|---|---|
| Voix | % | Voix | % | ||||
| François Asensi sortant réélu | FG (FASE) | 10 598 | 35,64 | 16 078 | 100,00 | ||
| Stéphane Gatignon | EÉLV (PS) | 7 503 | 25,23 | Retrait | |||
| Martine Valleton | UMP (NC) | 5 373 | 18,07 | ||||
| Pierre-Antoine Lebeault | FN | 4 040 | 13,59 | ||||
| Seid Ferrat | Divers | 811 | 2,73 | ||||
| Fabrice Scagni | MoDem | 332 | 1,12 | ||||
| Jean-Marc Naumovic | Divers écologiste (Cap21) | 300 | 1,01 | ||||
| Patrice Sinaud | Divers droite (DLR) | 146 | 0,49 | ||||
| Salah Keltoumi | Extrême gauche (LO) | 140 | 0,47 | ||||
| Daniel Kpode | Divers gauche (MRC) | 113 | 0,38 | ||||
| Serge Grimaldi | Extrême gauche (POI) | 105 | 0,35 | ||||
| Noël Lechat | Extrême gauche (NPA) | 103 | 0,35 | ||||
| Derradji Zeghlache | Divers écologiste (AÉI) | 94 | 0,32 | ||||
| Nathalie Soutinho | Divers droite (MPF) | 75 | 0,25 | ||||
| Maxime Dos Santos | Divers (Pirate) | 4 | 0,01 | ||||
| Inscrits | 62 048 | 100,00 | 62 048 | 100,00 | |||
| Abstentions | 31 866 | 51,36 | 41 646 | 67,12 | |||
| Votants | 30 182 | 48,64 | 20 402 | 32,88 | |||
| Blancs et nuls | 445 | 1,47 | 4 324 | 21,19 | |||
| Exprimés | 29 737 | 98,53 | 16 078 | 78,81 | |||
Douzième circonscription (Le Raincy)
| Candidat | Parti | Premier tour | Second tour | ||||
|---|---|---|---|---|---|---|---|
| Voix | % | Voix | % | ||||
| Pascal Popelin élu | PS | 12 387 | 37,22 | 17 308 | 54,10 | ||
| Éric Raoult sortant | UMP | 9 953 | 29,91 | 14 682 | 45,90 | ||
| Gisèle Metay | FN | 5 461 | 16,41 | ||||
| Martine Louaire | FG (PCF) | 1 783 | 5,36 | ||||
| Abdelali Meziane | EÉLV | 1 643 | 4,94 | ||||
| Montasser Charni | MoDem | 492 | 1,48 | ||||
| Mohamed Mechmache | Divers | 448 | 1,35 | ||||
| Stéphane Chassigneux | DLR | 339 | 1,02 | ||||
| Gilles Mettelet | MNR | 249 | 0,75 | ||||
| Élias Abouhamda-Meziani | AÉI | 148 | 0,44 | ||||
| Geneviève Reimeringer | LO | 126 | 0,38 | ||||
| Arnold Voillemin | S&P | 104 | 0,31 | ||||
| Sonia Casagrande | NPA | 103 | 0,31 | ||||
| Ahmed Khelifi | Divers | 42 | 0,13 | ||||
| Denis Gauci | Divers | 0 | 0,00 | ||||
| Inscrits | 64 451 | 100,00 | 64 452 | 100,00 | |||
| Abstentions | 30 794 | 47,78 | 31 476 | 48,84 | |||
| Votants | 33 657 | 52,22 | 32 976 | 51,16 | |||
| Blancs et nuls | 379 | 1,13 | 986 | 2,99 | |||
| Exprimés | 33 278 | 98,87 | 31 990 | 97,01 | |||
Articles connexes
Notes et références
- Liste des candidats PCD aux législatives 2012
- Liste des candidats MRC aux législatives 2012
- Liberté Politique, « Véronique Landwerlin - 2e - Seine-Saint-Denis - Législatives 2012 - Liberté Politique », sur www.libertepolitique.com (consulté le )
- Liste des candidats POI aux législatives 2012
- Liste des candidats Solidarité et Progrès aux législatives 2012
- Député sortant de la 6e circonscription.
 Portail de la politique française
  Portail de la Seine-Saint-Denis
  Portail des années 2010
Cet article est issu de Wikipedia. Le texte est sous licence Creative Commons – Attribution – Partage à l’identique. Des conditions supplémentaires peuvent s’appliquer aux fichiers multimédias.